Django:Templateで意図したものと別のファイルが読み込まれる時の原因と対策
 akinori
Django:Templateで意図したものと別のファイルが読み込まれる時の原因と対策
この場合、多くがTemplateディレクトリに置いたファイルの読まれ方の理解不足が原因です。
そして、多くの場合『同一プロジェクトに複数アプリ』という構成で構築している事でしょう。
私もこの【Templateディレクトリ】のファイルの扱いには悩まされました。
以降は具体的な例で解説していきます。
Templateが意図した通りに動かなかった事ありませんか?
私が経験したのはこんな動作です。
- 複数アプリを起動し「それぞれのサイドナビ」を「それぞれのTemplate直下にsidenav.htmlとして保存」したのにアプリごとにサイドナビの切り替えができない。
- TemplateSyntaxError が出たけど読み込もうとしたページで利用していないはずの 引数に対してエラーを指摘された。
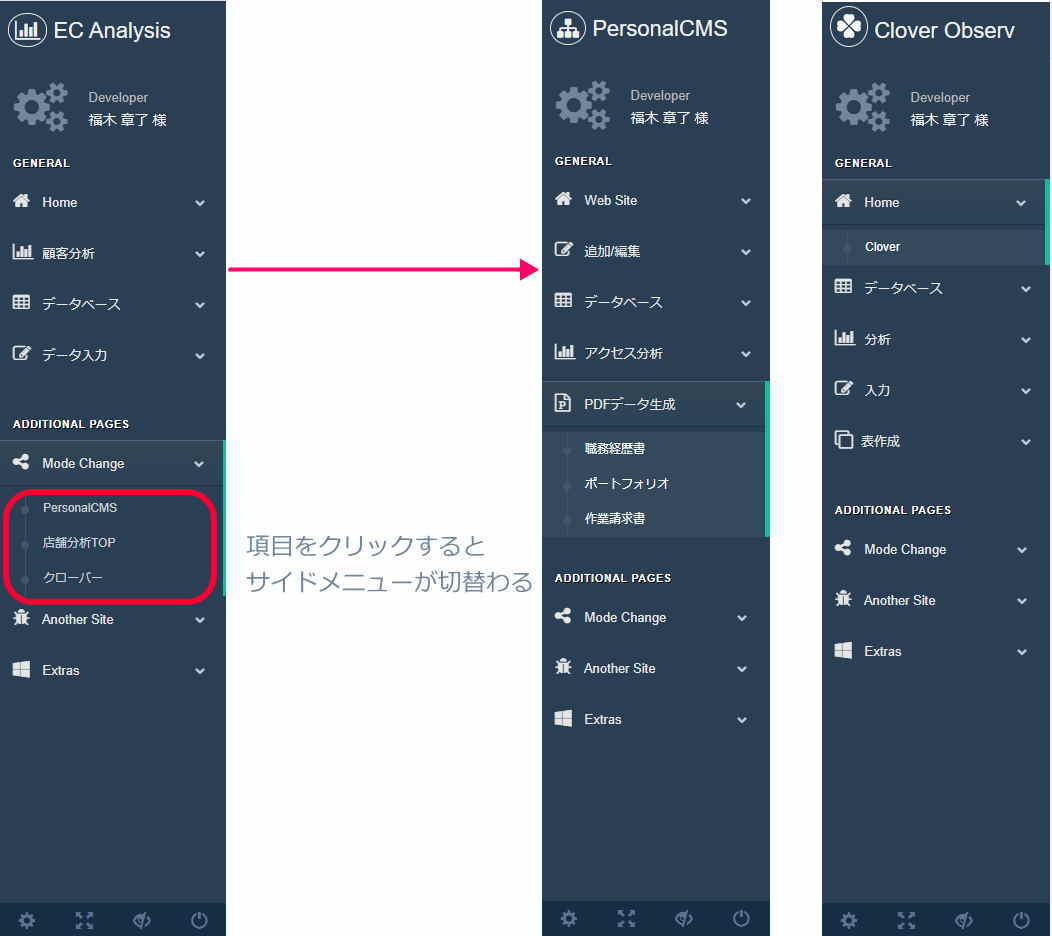 この画像は1の例です。実際に私が作成している「自分専用アプリ」のサイドメニュー画面になります。この例ではModeChange内にあるリストをクリックすると其々のページにJUMPし、専用メニューが出てくるようにしています。
店舗分析では店舗分析専用の遷移、パーソナルCMSではシステム屋のとしての遷移といったようにアプリ毎にメニュー構成を変えたいという要望は多くあると思います。
ちなみに、Cloverは娘の自由研究用のDBです。私のグラフ作成練習にちょうどいいのでパーソナルシステムに組み込んでしまいました。
こういったアプリ毎のサイドメニューの切り替えをしたかったのですが、何故か意図した通りに動いてくれなかったんですよね。
Templateディレクトリは全てのアプリで統合管理されている
私の経験した上の項目1-2ですが根本原因はTemplateディレクトリの理解不足でした。
意図したとおりに動くTemplateディレクトリ構成
教本などでは「アプリのディレクトリにTemplateディレクトリを作成する」と記載されていることが多いので、多くの方がこんな感じの構成(アプリごとにTemplateがある構成)を取っているのではないかと思います。
例えばこのような構成のTemplateディレクトリがあったとします。
├─ プロジェクト
│ └─ settings.py
(中略)
├─ アプリ1
│ ├─ __pycache__
│ ├─ migrations
│ ├─ templates
│ │ ├─ app01
│ │ │ ├─ index.html
│ │ │ ├─ edit.html
│ │ │ ├─ create.html
│ │ │ └─ sidnavi.html
│ │ └─ base.html
(中略)
├─ アプリ2
│ ├─ __pycache__
│ ├─ migrations
│ ├─ templates
│ │ ├─ app02
│ │ │ ├─ index.html
│ │ │ ├─ edit.html
│ │ │ ├─ create.html
│ │ │ └─ sidnavi.html
│ │ └─ footer.html
(中略)
├─ アプリ3
│ ├─ __pycache__
│ ├─ migrations
│ ├─ templates
│ │ ├─ app03
│ │ │ ├─ index.html
│ │ │ ├─ edit.html
│ │ │ ├─ create.html
│ │ │ └─ sidnavi.html
│ │ └─test.html
(中略)
└── manage.py
これ、Djangoの中では下のように見えています。
├─ プロジェクト
│ └─ settings.py
(中略)
├─ アプリ1
│ ├─ __pycache__
│ ├─ migrations
│ ├─ templates
│ │ ├─ app01
│ │ │ ├─ index.html
│ │ │ ├─ edit.html
│ │ │ ├─ create.html
│ │ │ └─ sidnavi.html
│ │ ├─ app02
│ │ │ ├─ index.html
│ │ │ ├─ edit.html
│ │ │ ├─ create.html
│ │ │ └─ sidnavi.html
│ │ ├─ app03
│ │ │ ├─ index.html
│ │ │ ├─ edit.html
│ │ │ ├─ create.html
│ │ │ └─ sidnavi.html
│ │ ├─ test.html
│ │ ├─ footer.html
│ │ └─ base.html
(中略)
├─ アプリ2
│ ├─ __pycache__
│ ├─ migrations
│ ├─ templates
│ │ ├─ app01
│ │ │ ├─ index.html
│ │ │ ├─ edit.html
│ │ │ ├─ create.html
│ │ │ └─ sidnavi.html
(中略)
├─ アプリ3
│ ├─ __pycache__
│ ├─ migrations
│ ├─ templates
│ │ ├─ app01
│ │ │ ├─ index.html
│ │ │ ├─ edit.html
│ │ │ ├─ create.html
│ │ │ └─ sidnavi.html
(中略)
└── manage.py
どのアプリから見ても『分割して書いたはず』のTemplateがまとめて置いてありますよね。
なので、共通して使う base.html のようなファイルとアプリを超えて流用しないファイルはディレクトリ名で区分けする必要があります。
Templateディレクトリの間違えた構成例
上記理由により、こんな書き方すると意図した場所を読み込まず「作ったはずのページじゃない」とか「書いてない引数がエラーを起こす」といった現象が発生します。
├─ プロジェクト
│ └─ settings.py
(中略)
├─ アプリ1
│ ├─ __pycache__
│ ├─ migrations
│ ├─ templates
│ │ ├─ CRUD
│ │ │ ├─ index.html
│ │ │ ├─ edit.html
│ │ │ └─ create.html
│ │ ├─ sidnavi.html
│ │ ├─ base.html
│ │ └─ footer.html
(中略)
├─ アプリ2
│ ├─ __pycache__
│ ├─ migrations
│ ├─ templates
│ │ ├─ CRUD
│ │ │ ├─ index.html
│ │ │ ├─ edit.html
│ │ │ └─ create.html
│ │ ├─ sidnavi.html
│ │ ├─ base.html
│ │ └─ footer.html
(中略)
├─ アプリ3
│ ├─ __pycache__
│ ├─ migrations
│ ├─ templates
│ │ ├─ CRUD
│ │ │ ├─ index.html
│ │ │ ├─ edit.html
│ │ │ └─ create.html
│ │ ├─ sidnavi.html
│ │ ├─ base.html
│ │ └─ footer.html
(中略)
└── manage.py
この機能はうまく使えば非常にありがたい
具体的に言えば【共通パーツ化】の実装が簡単です。
例えば「分析用のグラフ描写を外部パーツ化する」とか「内部アプリの基礎構成を共通化する」とか。
グラフ描写で具体的に流れを追ってみます。
グラフ描写の外部パーツ化について
Django:複数アプリで利用する関数を共通化する方法
この記事で書いた通り、関数はUSEすることでどのアプリからも呼び出すことができます。
そして、Templateディレクトリに配置するhtmlはどのアプリからも同一ディレクトリにあるように呼び出すことができます。例えば、アプリ1にのみGraphsディレクトリを作成した下のような構成を作ったとします。
├─ プロジェクト
│ └─ settings.py
(中略)
├─ アプリ1
│ ├─ __pycache__
│ ├─ migrations
│ ├─ templates
│ │ ├─ app01
│ │ │ ├─ index.html
(中略)
│ │ ├─ Graphs
│ │ │ ├─ flot_line.html
│ │ │ ├─ echart_2bar.html
│ │ │ ├─ echart_scatter.html
│ │ │ └─ echart_line.html
│ │ ├─ base.html
│ │ └─ footer.html
(中略)
├─ アプリ2
│ ├─ __pycache__
│ ├─ migrations
│ ├─ templates
│ │ ├─ app02
│ │ │ ├─ index.html
(中略)
├─ アプリ3
│ ├─ __pycache__
│ ├─ migrations
│ ├─ templates
│ │ ├─ app03
│ │ │ ├─ index.html
(中略)
└── manage.py
この構成でアプリ1/Template/Graphs/echart_scatter.htmlを呼び出すには下のようにIncludeします。
▼アプリ1/Template/app01/index.html でInclude
  <!-- 分布図 -->
  {% include 'Graph/echart_scatter.html'%}
▼アプリ2/Template/app02/index.html でInclude
  <!-- 分布図 -->
  {% include 'Graph/echart_scatter.html'%}
▼アプリ3/Template/app03/index.html でInclude
  <!-- 分布図 -->
  {% include 'Graph/echart_scatter.html'%}
全く同じですね。
描写する値は引数で JavaScript に渡すわけですからHTML的にはこんな感じで仕上がってしまいます。
■アプリ1/Template/Graphs/echart_scatter.html
<!--
 必要なJS はページ上部で読み込ませましょう。
 ページ下部で読み込ませると、echart_scatter.html 内のJS適用がエラーを発するため
 外部パーツとして完結できません。
 ※ 引数のJS受け渡しのScriptをincludeするファイル側に書き込む必要が出てきます。
-->
  <div class="x_content">
    <!-- Graph -->
    <div class="echart_scatter" style="height:350px;"></div>
    <!-- Graph -->
  </div>

  <script>
    var Scatter_01 = {{ Scatter.0|safe }}
    var Scatter_02 = {{ Scatter.1|safe }}
    var Scatter_title01 = '{{Scatter.2}}'
    var Scatter_title02 = '{{Scatter.3}}'
    var Scatter_dataname01 = '{{Scatter.4}}'
    var Scatter_dataname02 = '{{Scatter.5}}'
    var Scatter_XUnit = '{{Scatter.6}}'
    var Scatter_YUnit = '{{Scatter.7}}'
  </script>
EChartの分散図だったら下のJSで描写できます。
/* Echart */
function init_echarts() {
if (typeof(echarts) === 'undefined') {
return;
}
var theme = {
color: [
'#26B99A', '#34495E', '#BDC3C7', '#3498DB',
'#9B59B6', '#8abb6f', '#759c6a', '#bfd3b7'
],
title: {
itemGap: 8,
textStyle: {
fontWeight: 'normal',
color: '#408829'
}
},
dataRange: {
color: ['#1f610a', '#97b58d']
},
toolbox: {
color: ['#408829', '#408829', '#408829', '#408829']
},
tooltip: {
backgroundColor: 'rgba(0,0,0,0.5)',
axisPointer: {
type: 'line',
lineStyle: {
color: '#408829',
type: 'dashed'
},
crossStyle: {
color: '#408829'
},
shadowStyle: {
color: 'rgba(200,200,200,0.3)'
}
}
},
dataZoom: {
dataBackgroundColor: '#eee',
fillerColor: 'rgba(64,136,41,0.2)',
handleColor: '#408829'
},
grid: {
borderWidth: 0
},
categoryAxis: {
axisLine: {
lineStyle: {
color: '#408829'
}
},
splitLine: {
lineStyle: {
color: ['#eee']
}
}
},
valueAxis: {
axisLine: {
lineStyle: {
color: '#408829'
}
},
splitArea: {
show: true,
areaStyle: {
color: ['rgba(250,250,250,0.1)', 'rgba(200,200,200,0.1)']
}
},
splitLine: {
lineStyle: {
color: ['#eee']
}
}
},
timeline: {
lineStyle: {
color: '#408829'
},
controlStyle: {
normal: { color: '#408829' },
emphasis: { color: '#408829' }
}
},
k: {
itemStyle: {
normal: {
color: '#68a54a',
color0: '#a9cba2',
lineStyle: {
width: 1,
color: '#408829',
color0: '#86b379'
}
}
}
},
map: {
itemStyle: {
normal: {
areaStyle: {
color: '#ddd'
},
label: {
textStyle: {
color: '#c12e34'
}
}
},
emphasis: {
areaStyle: {
color: '#99d2dd'
},
label: {
textStyle: {
color: '#c12e34'
}
}
}
}
},
force: {
itemStyle: {
normal: {
linkStyle: {
strokeColor: '#408829'
}
}
}
},
chord: {
padding: 4,
itemStyle: {
normal: {
lineStyle: {
width: 1,
color: 'rgba(128, 128, 128, 0.5)'
},
chordStyle: {
lineStyle: {
width: 1,
color: 'rgba(128, 128, 128, 0.5)'
}
}
},
emphasis: {
lineStyle: {
width: 1,
color: 'rgba(128, 128, 128, 0.5)'
},
chordStyle: {
lineStyle: {
width: 1,
color: 'rgba(128, 128, 128, 0.5)'
}
}
}
}
},
gauge: {
startAngle: 225,
endAngle: -45,
axisLine: {
show: true,
lineStyle: {
color: [
[0.2, '#86b379'],
[0.8, '#68a54a'],
[1, '#408829']
],
width: 8
}
},
axisTick: {
splitNumber: 10,
length: 12,
lineStyle: {
color: 'auto'
}
},
axisLabel: {
textStyle: {
color: 'auto'
}
},
splitLine: {
length: 18,
lineStyle: {
color: 'auto'
}
},
pointer: {
length: '90%',
color: 'auto'
},
title: {
textStyle: {
color: '#333'
}
},
detail: {
textStyle: {
color: 'auto'
}
}
},
textStyle: {
fontFamily: 'Arial, Verdana, sans-serif'
}
};
//echart Scatter
if ($('.echart_scatter').length) {
var echartScatter = echarts.init(document.getElementsByClassName('echart_scatter'), theme);
echartScatter.setOption({
title: {
text: Scatter_title01,
subtext: Scatter_title02
},
tooltip: {
trigger: 'axis',
showDelay: 0,
axisPointer: {
type: 'cross',
lineStyle: {
type: 'dashed',
width: 1
}
}
},
legend: {
data: [Scatter_dataname02, Scatter_dataname01]
},
toolbox: {
show: true,
feature: {
saveAsImage: {
show: true,
title: "Save Image"
}
}
},
xAxis: [{
type: 'value',
scale: true,
axisLabel: {
formatter: '{value} '+ Scatter_XUnit
}
}],
yAxis: [{
type: 'value',
scale: true,
axisLabel: {
formatter: '{value} '+ Scatter_YUnit
}
}],
series: [{
name: Scatter_dataname01,
type: 'scatter',
tooltip: {
trigger: 'item',
formatter: function(params) {
if (params.value.length > 1) {
return params.seriesName + ' :<br/>' + params.value[0] + Scatter_XUnit + ' ' + params.value[1] + Scatter_YUnit;
} else {
return params.seriesName + ' :<br/>' + params.name + ' : ' + params.value + Scatter_YUnit;
}
}
},
data: Scatter_01,
markPoint: {
data: [{
type: 'max',
name: 'Max'
}, {
type: 'min',
name: 'Min'
}]
},
markLine: {
data: [{
type: 'average',
name: 'Mean'
}]
}
}, {
name: Scatter_dataname02,
type: 'scatter',
tooltip: {
trigger: 'item',
formatter: function(params) {
if (params.value.length > 1) {
return params.seriesName + ' :<br/>' + params.value[0] + Scatter_XUnit + ' ' + params.value[1] + Scatter_YUnit;
} else {
return params.seriesName + ' :<br/>' + params.name + ' : ' + params.value + Scatter_YUnit;
}
}
},
data: Scatter_02,
markPoint: {
data: [{
type: 'max',
name: 'Max'
}, {
type: 'min',
name: 'Min'
}]
},
markLine: {
data: [{
type: 'average',
name: 'Mean'
}]
}
}]
});
}
}
$(document).ready(function() {
init_echarts();
});
外部パーツ化のメリットとは
外部パーツ化は自分が楽になるために行う作業です。
単純な単体実装であれば、共通パーツなどは作成しない方が作業効率は増します。
理由は【このデータはこうなっている】というルールを実装で使えるからです。
例えば、X軸は日付データという確定した内容があれば『日付か確認して日付だったら表示できる姿に変更する』といった処理を踏む必要がありません。
ただし、この場合は同じようなSCRIPTを何回も書くことになります。
反復練習としてはとても良いのですが、プログラマは時間も商売道具です。
早く書き上げるに越したことはないとなれば、一回経験したもので外部パーツ化できるものは積極的にパーツ化して次の案件に生かしていけばOKですよね。
まとめ
先回の記事でグラフの外部パーツ化について触れておきながら、Templateのことは何も書かなかったなと思い記事化してみました。
さぁ、今日も頑張りましょう!
\ 最新情報をチェック /